
The Kijun-Sen
ICHIMOKU KINKO HYO - KIJUN-SEN (IN SUMMARY)
Before you start reading this chapter, please note that you cannot trade with the Kijun-Sen alone. The Kijun is part of a global system, where everything fits together, and everything makes sense.
To learn how to juggle with all the components of the system you can check the resources here:
Video recording of my conference at FXCM: Conference (in French): What is Ichimoku?
If you want to dig deeper into the learning process check my Ichimoku Course here: ICHIMOKU KINKO HYO THE COMPLETE COURSE
Read testimonials from people who bought my courses here Golden Book
My Ichimoku YouTube channel: The 100% Ichimoku channel
The Kijun is a line of average points. It depicts the average of the highest and lowest prices over the last 26 periods. The Kijun-Sen indicates the equilibrium over the last 26 periods.
Unlike a traditional moving average, The Kijun-Sen forms increments (read the chapter about the Tenkan-Sen, to understand this).
These increments are important levels of support or resistance.
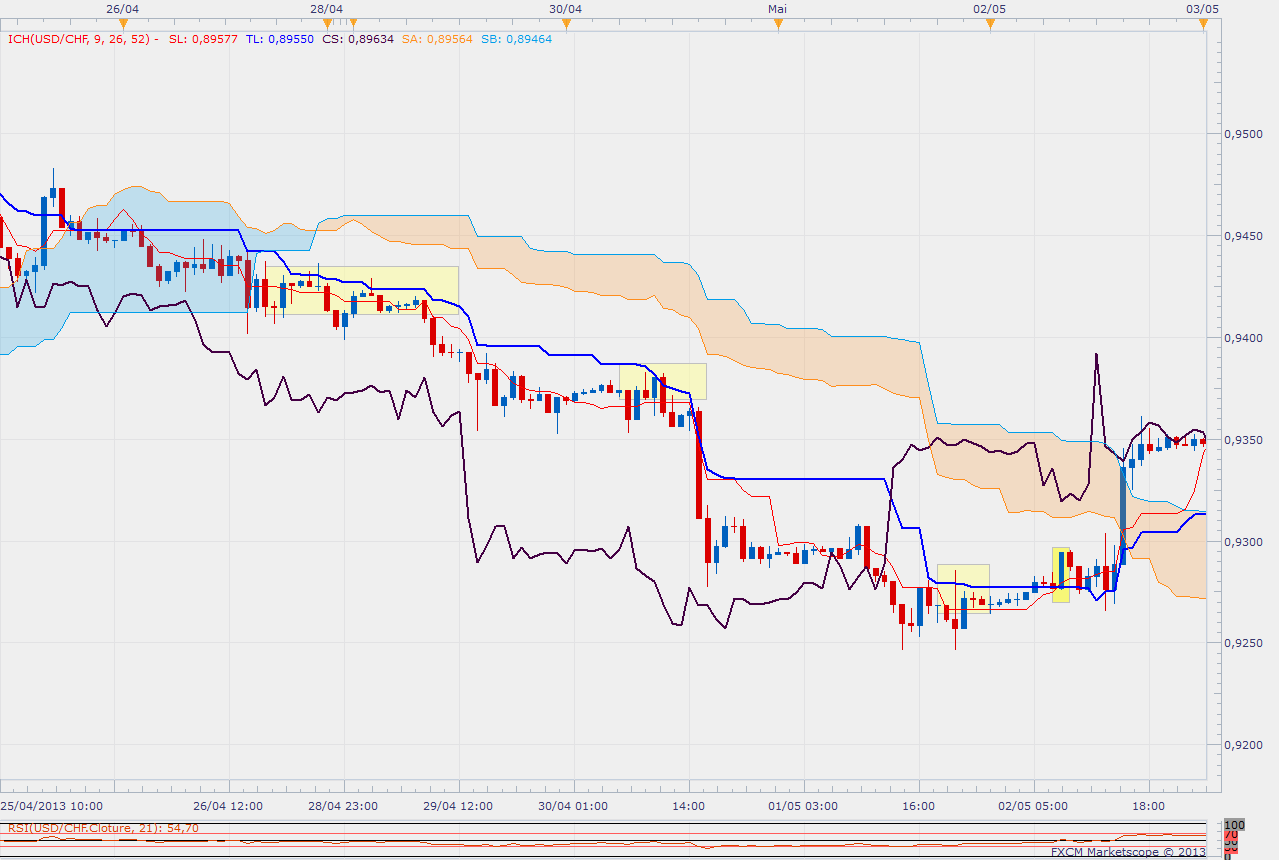
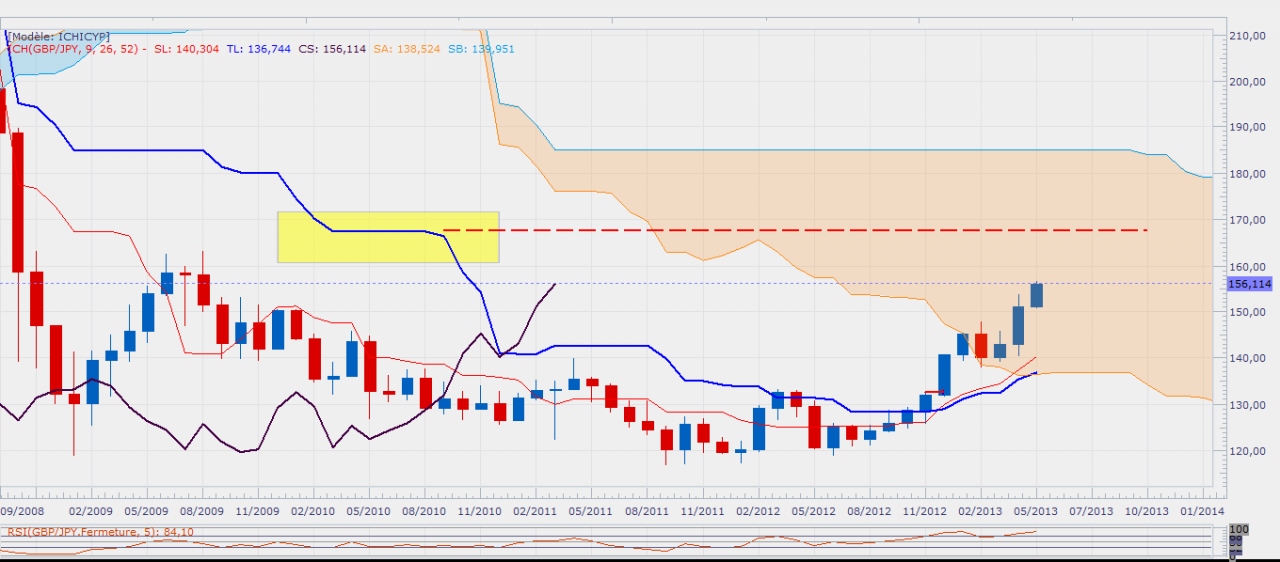
On the chart below the trend is bearish; all the Kijun are resistance levels. As long as prices don't break the Kijun Sen, the trend remains confirmed.
The trend can be questioned only if the Kijun is broken by the prices at the bottom of the chart (candlestick signaled by a bright yellow rectangle).
The other rectangles show the resistance levels of the Kijun (the increments).
On the chart below, the increments formed by the Kijun become support levels.
During a market trend, in this type of situation, the Kijun allows you to:
- Keep your position until the trend moves in the opposite direction
- Enter into a position as soon as prices throw back towards a Kijun Flat (under certain conditions);
- Reinforce your position and use pyramidal trading
- Open a position to follow the trend in case you did not catch the train yet
- Identify and move up your stop losses.
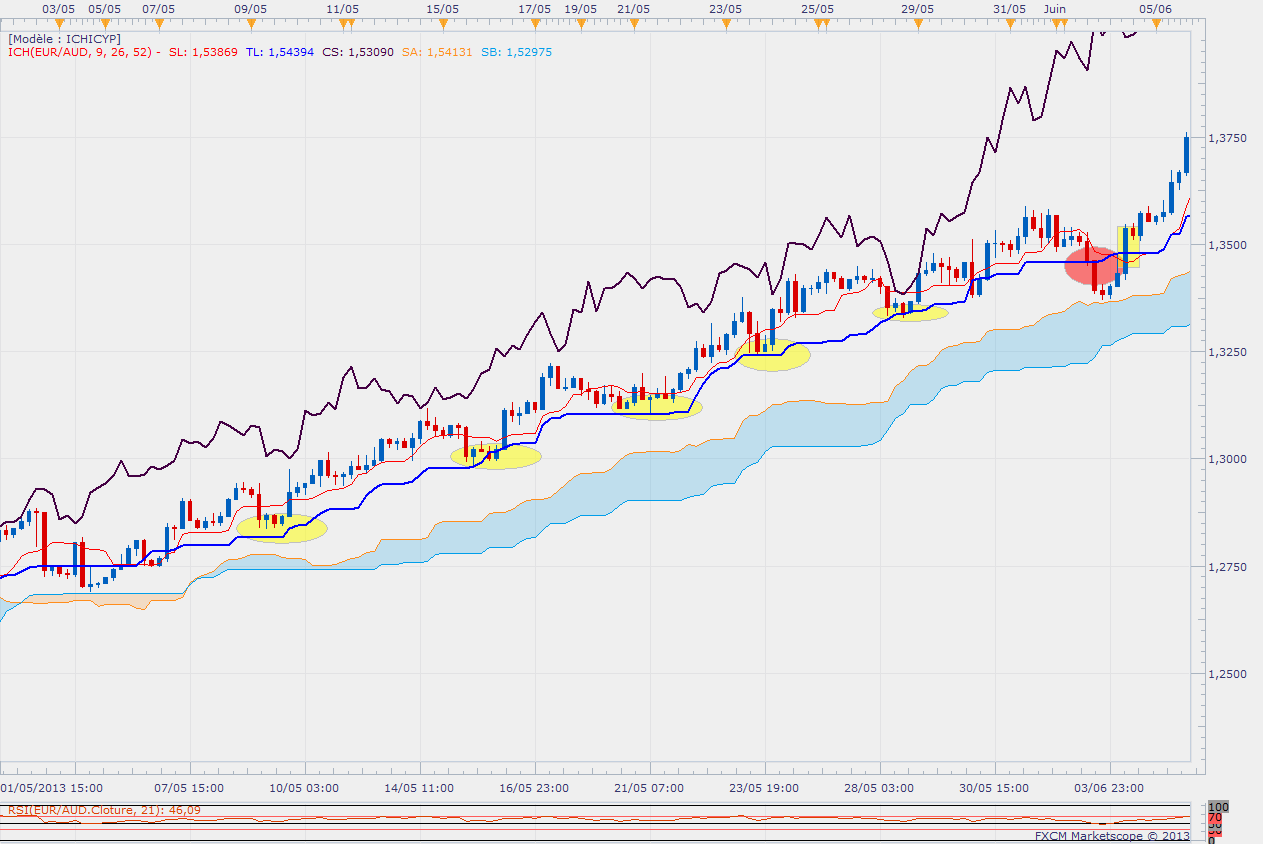
The Kijun-Sen tells us about the strength of the trend. It's very simple - the greater its angle (its inclination) the stronger the trend. Conversely, a flat Kijun-Sen will indicate a break in the trend.
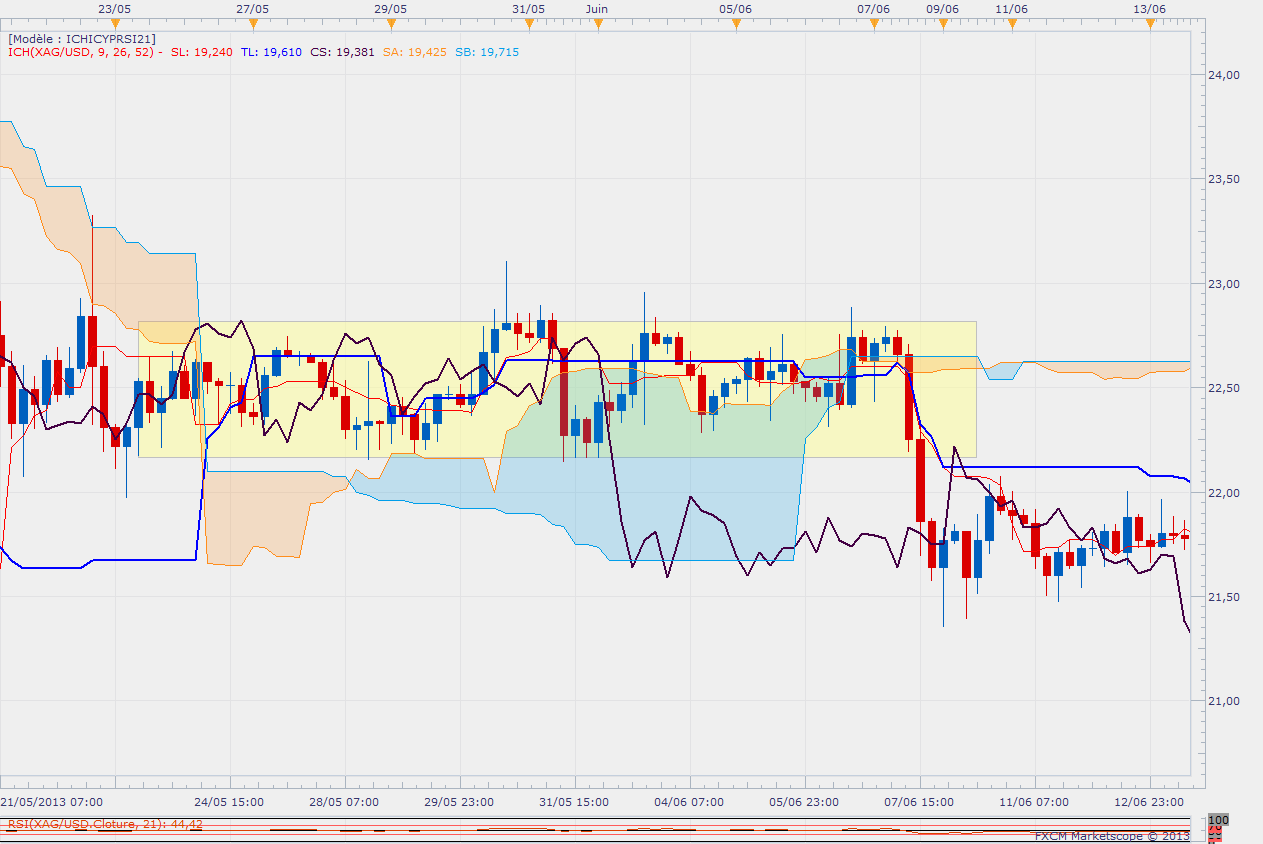
On the chart below (yellow rectangle), we experience a range market, withcprices crossing the Kijun in both directions.
It’s important to remember that in a range market, the Kijun-Sen, like all the other Ichimoku lines within the range, is not a relevant support or resistance level anymore. The prices and the Chikou-Span cross them easily. (Regarding this topic, see also the chapter about the Ichimoku Cloud).
A Kijun Flat acts as a powerful magnet on the prices.
When the prices move away from the Kijun too quickly then, provided the Kijun remains flat, they act as they were attached to it by a rubber band that pulls them back irremediably. In these cases, the chances of seeing the prices pull back or throw back towards the Kijun are significant. In this type of situation, the Kijun very often indicates the 50% Fibonacci retracement level, as you can see in the chart below.
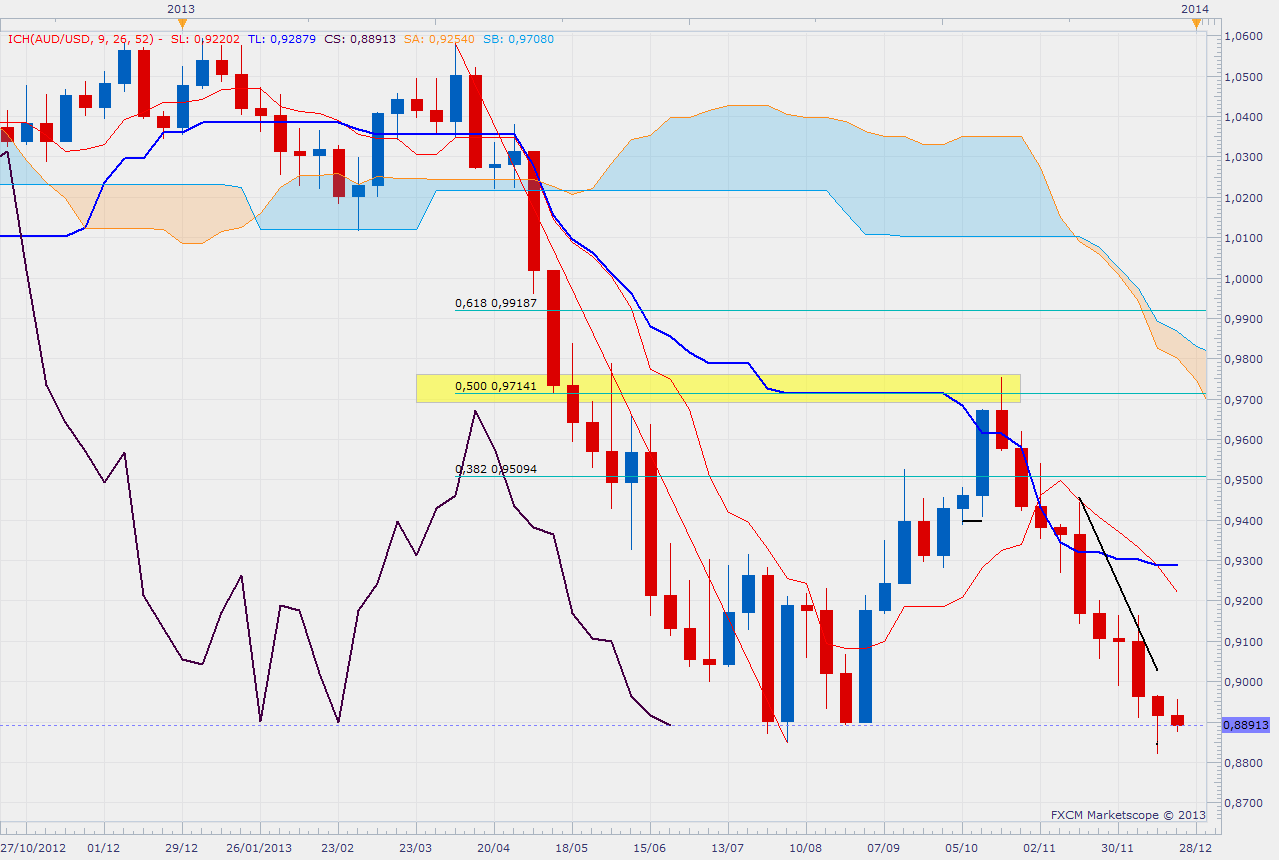
The extension of an old Kijun Flat can also become a support or resistance level, as you can see in the chart below. Drawing an extension line based on an older Kijun Flat gives you a reliable resistance level. You can be certain that the prices will have a hard time breaking that resistance.
The interaction of the Kijun with the Chikou-Span is also of great importance. See this Chikou-Span tutorial.
Would you like to learn more about how to use the Kijun Sen and the information it delivers?
Kijun-Sen video,(in French) this video explains everything you need to know about the Kijun-Sen for your trading.


