The Tenkan-Sen
INTRODUCTION TO TENKAN-SEN - ICHIMOKU
Check out my Ichimoku YouTube Channel: 100% ICHIMOKU KINKO HYO YOUTUBE CHANNEL
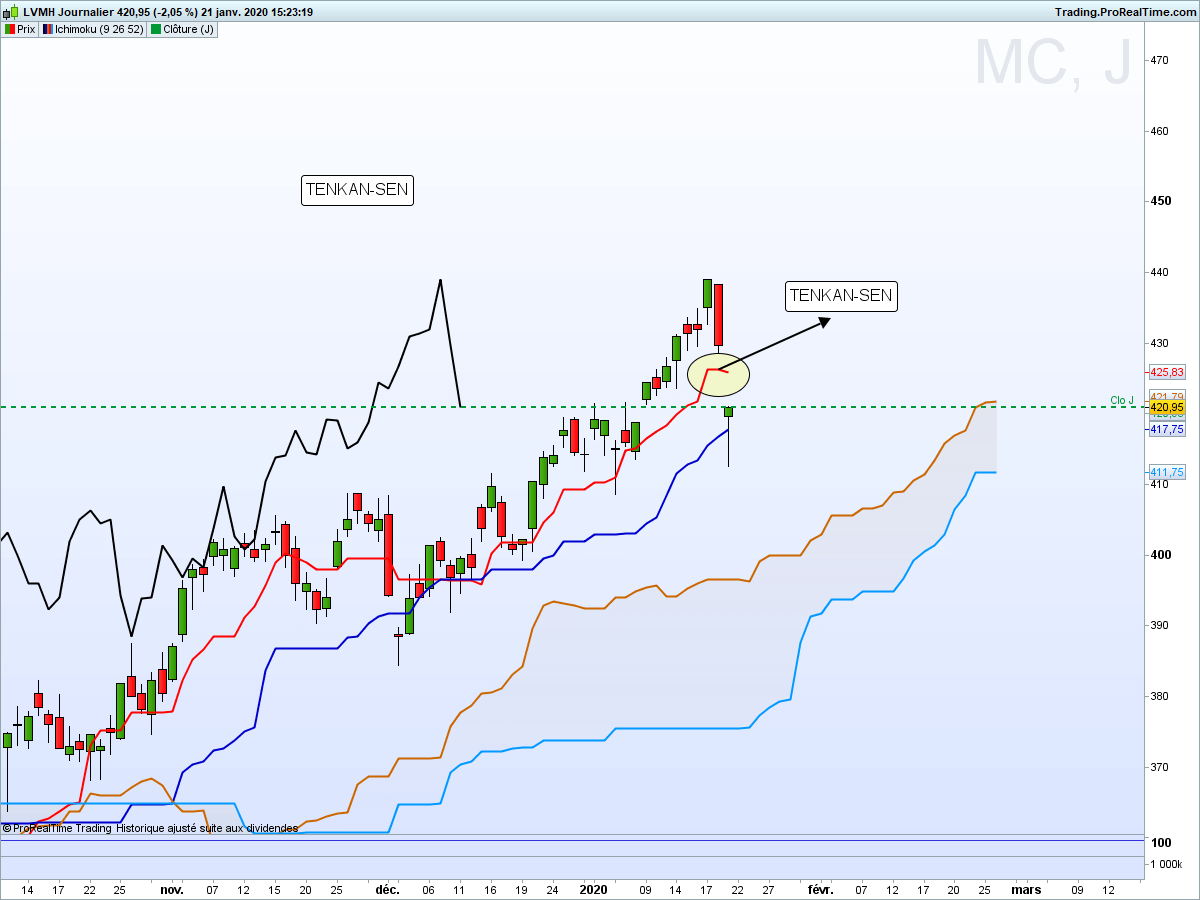
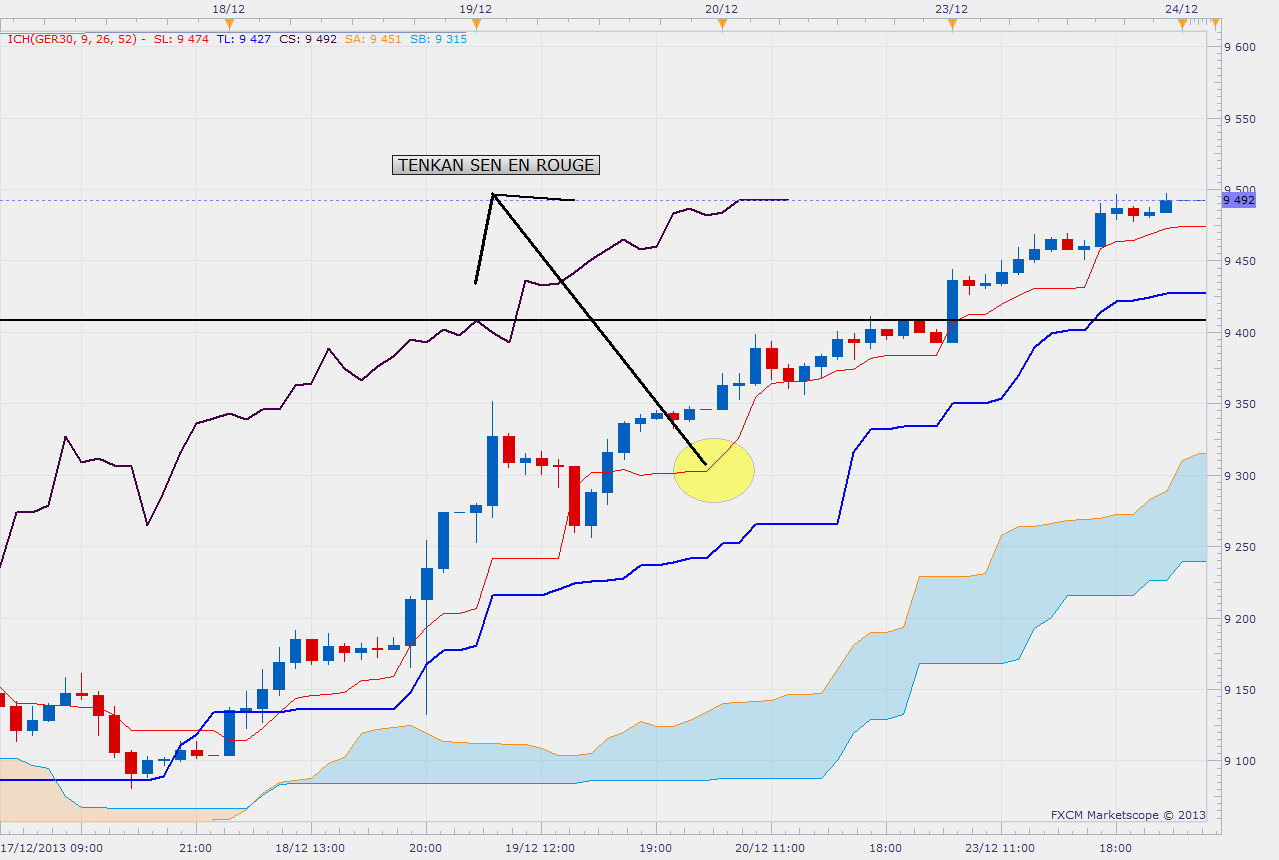
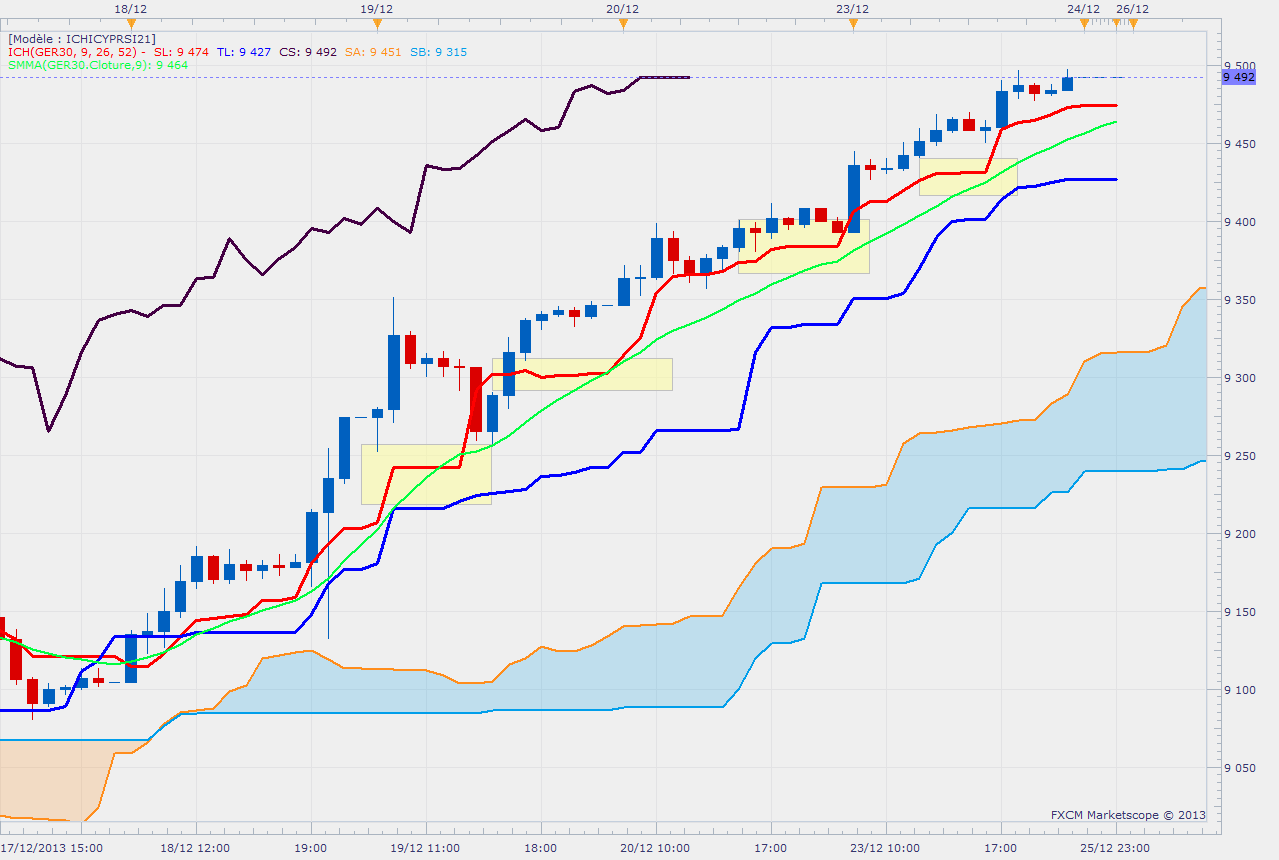
On the chart below (click to enlarge) the Tenkan-Sen is represented by the red line (you can change the color in the settings).
THE TENKAN SEN ( IN SUMMARY)
It is the average of the highest and the lowest of the last 9 periods. Over the last 9 periods (the last 9 candlesticks), we add the highest point to the lowest point, and then divide the total by 2.
The Tenkan-Sen represents the equilibrium over the last 9 periods. It is the fastest moving line of all the Ichimoku lines.
The difference with a conventional moving average lies in its calculation - a simple moving average is representative of the average price at closing.
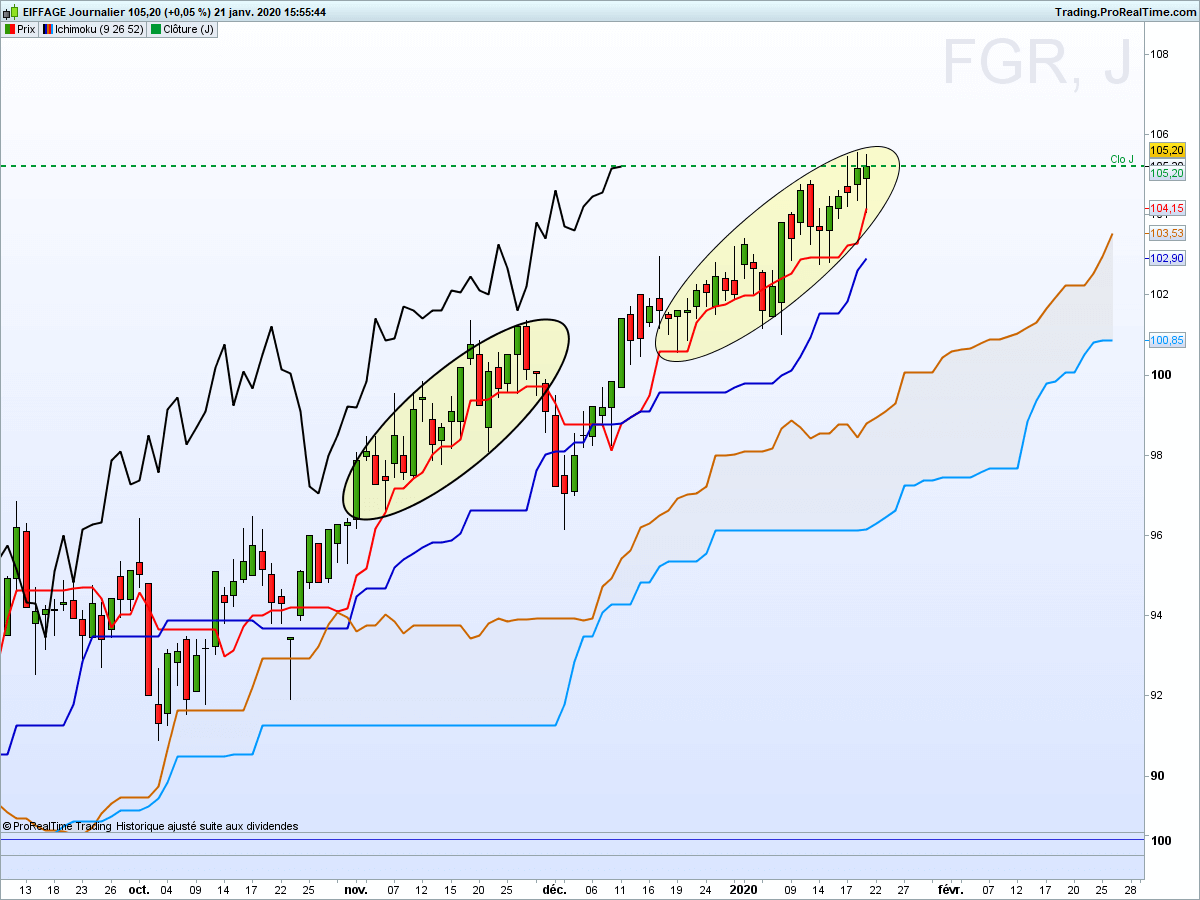
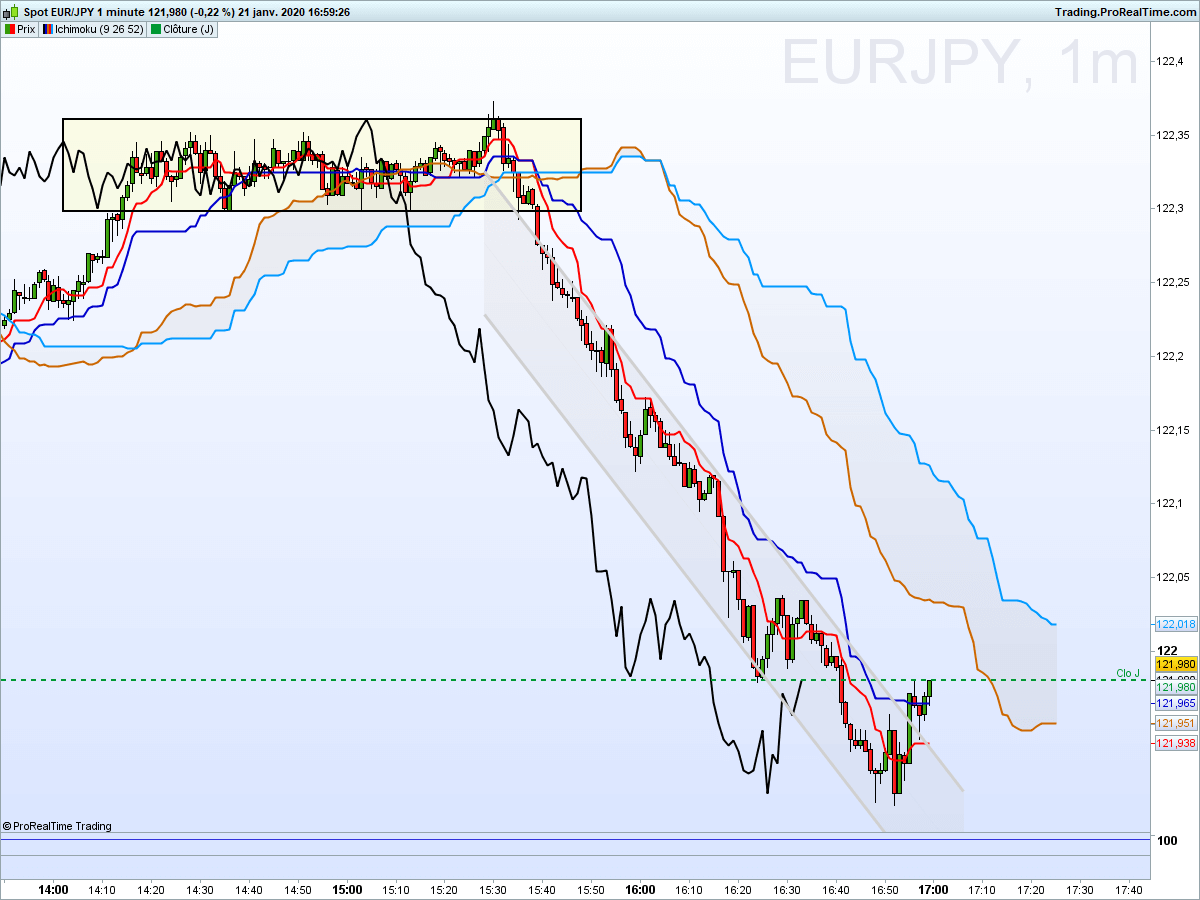
Visually this creates a noteworthy difference, as the Tenkan-Sen forms step patterns, unlike an SMA (simple moving average) that will always remain oriented. The horizontal parts of these patterns can be used as support or resistance levels.
The graph below shows the visual difference between the Tenkan in red and a 9-period moving average in green. I have highlighted with yellow rectangles the spots where the Tenkan displays forms step patterns so you can compare it easily with the SMA.
The larger the Tenkan angle (inclination), the stronger the trend. When the Tenkan is flat, it simply indicates that during the last nine periods (last 9 candlesticks) the prices have not reached any new highs or lows. Once you have identified these Tenkan Flats (for “flat areas”), you can use them as support or resistance levels.
As you can see in the chart above, the Tenkan sen sticks close to the price (this is due to his calculation set over a short period, hence it is the fastest line of the Ichimoku system). When prices move too far away from the Tenkan-Sen, it means that there is a lack of balance in the market, it indicates that the asset is in "overbought" or "oversold" territory.
During any strong market trend, the Tenkan-Sen is often the first support or resistance level.
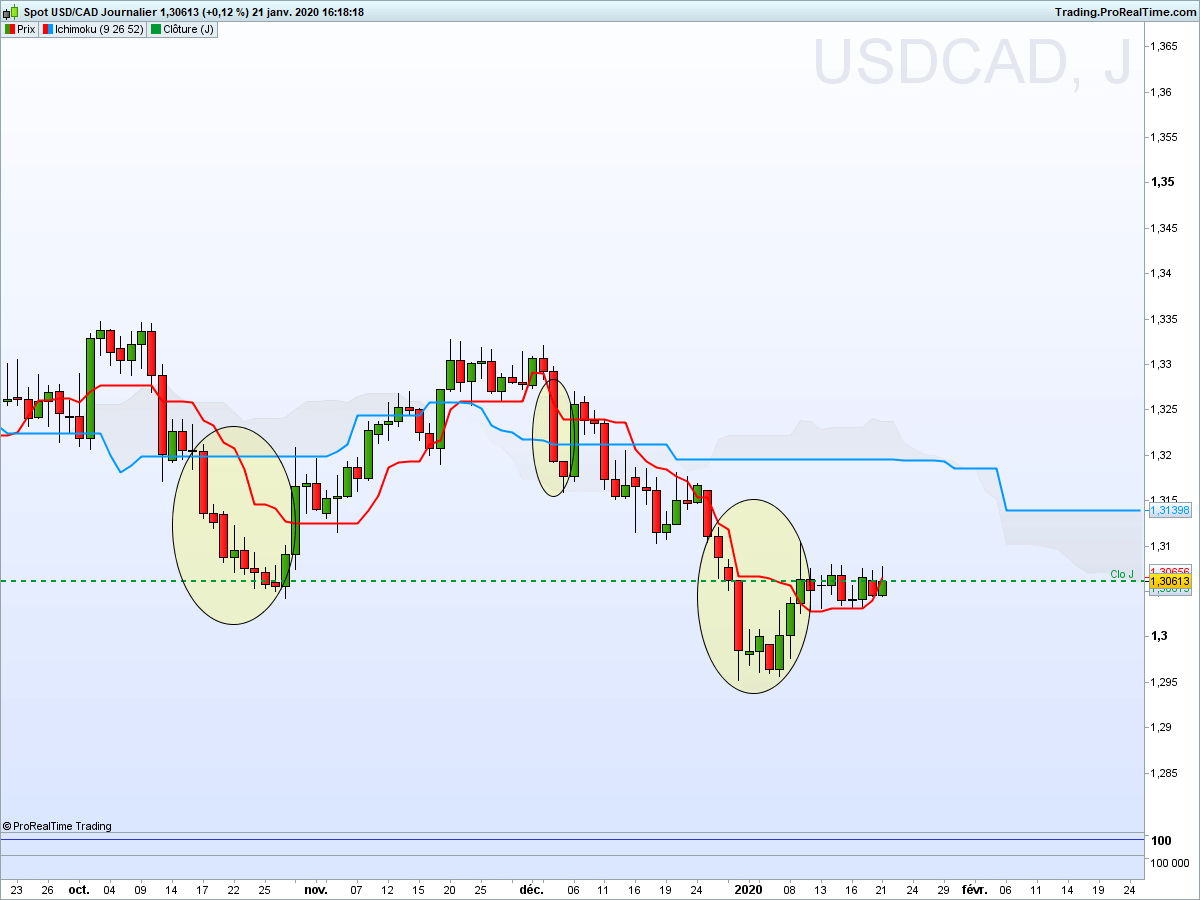
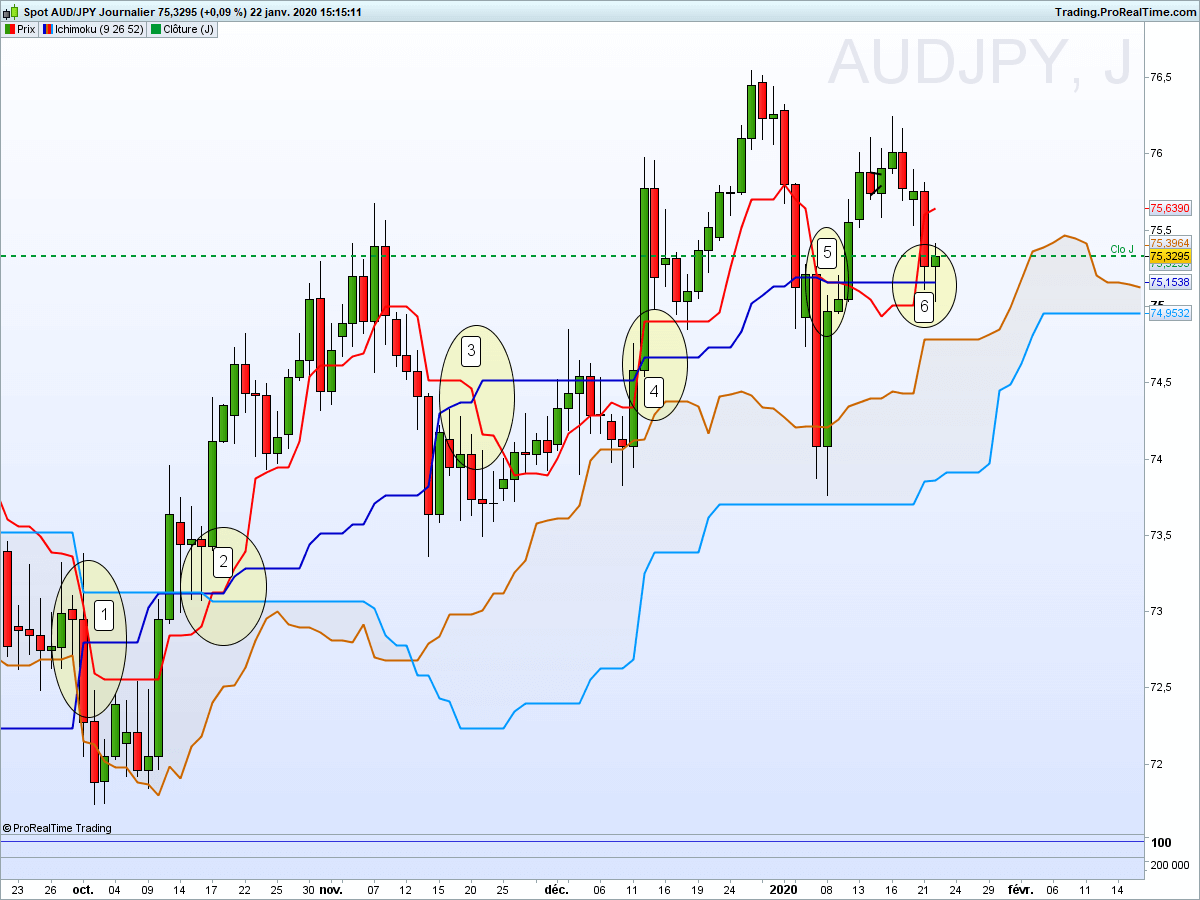
On the GBPAUD daily chart below, all the Tenkan Flats under the price levels (including their extensions) are support levels.
Therefore, it is worth to remember that any old Tenkan flat visible on the chart (this is true for all the Ichimoku lines) can turn into a support or resistance level.

THE TENKAN KIJUN CROSS
Let's lay to rest a terrible misconception about Ichimoku!
For some people, this crossing is the only thing they know about Ichimoku and this is, by the way, a pity! Because there's so much more to Ichimoku than that!
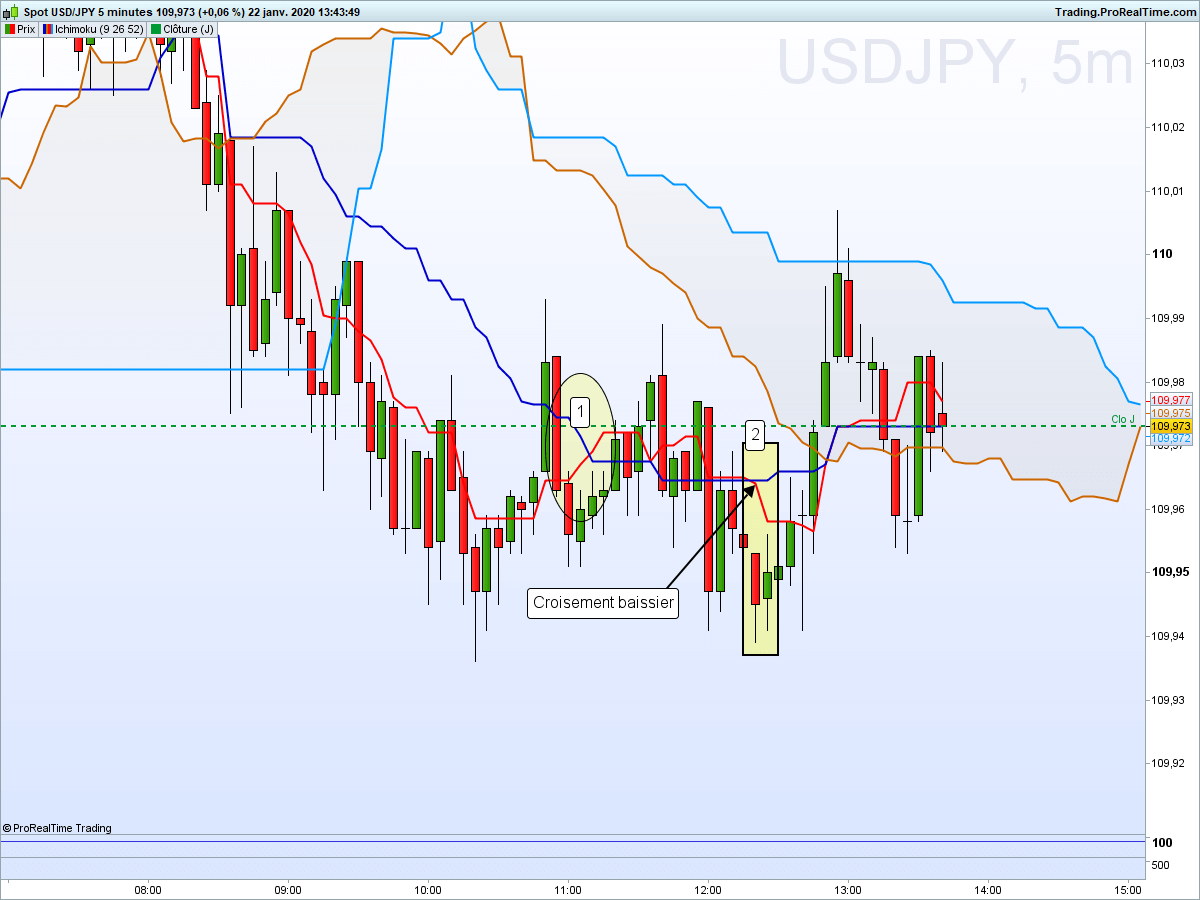
The crossing of the Kijun by the Tenkan is often considered to be a buy or a sell signal.
But waiting for the crossing to occur is actually much too late and risky if one wants to enter the market. Other entry signals often occur well before this crossing, and are much more relevant.
You will read almost everywhere that a bullish Tenkan/Kijun cross occurring above the cloud is a strong buy signal, that it is an average buy signal when occurring in the cloud, and that it is a weak buy signal when occurring under the cloud.
Needless to say, I do not recommend subscribing to this method! It would be too bad to limit your understanding of Ichimoku to such mere tricks! The inventor of Ichimoku, Mr. Goishi Hosoda, certainly didn't spend 30 years of his life on creating a trading system just to come up with a petty story about two crossing lines!