The Ichimoku Cloud (Kumo)
The Ichimoku Cloud (Kumo)
The Cloud is undoubtedly the component that makes the Ichimoku Kinko Hyo system so unusual. The Kumo plays a major role in reading and interpreting Ichimoku graphics. It instantly provides us with relevant information on the trend, regardless of the timeframe. Its projection in the future is a remarkable feature. The lines that form the cloud (Senkou-Span A and Senkou-Span B) also deliver accurate support and resistance levels.
"The cloud will tell the trend followers what they need to know"
This quote is from Tyler Yell, a Forex Trading Instructor, and it emphasizes the first thing you should do when you open Ichimoku chart.
The Cloud informs us in the blink of an eye about the state of the market.
In other words, the Ichimoku Cloud immediately tells us if the prices are in a trend phase, or in a lateral drift phase (range).
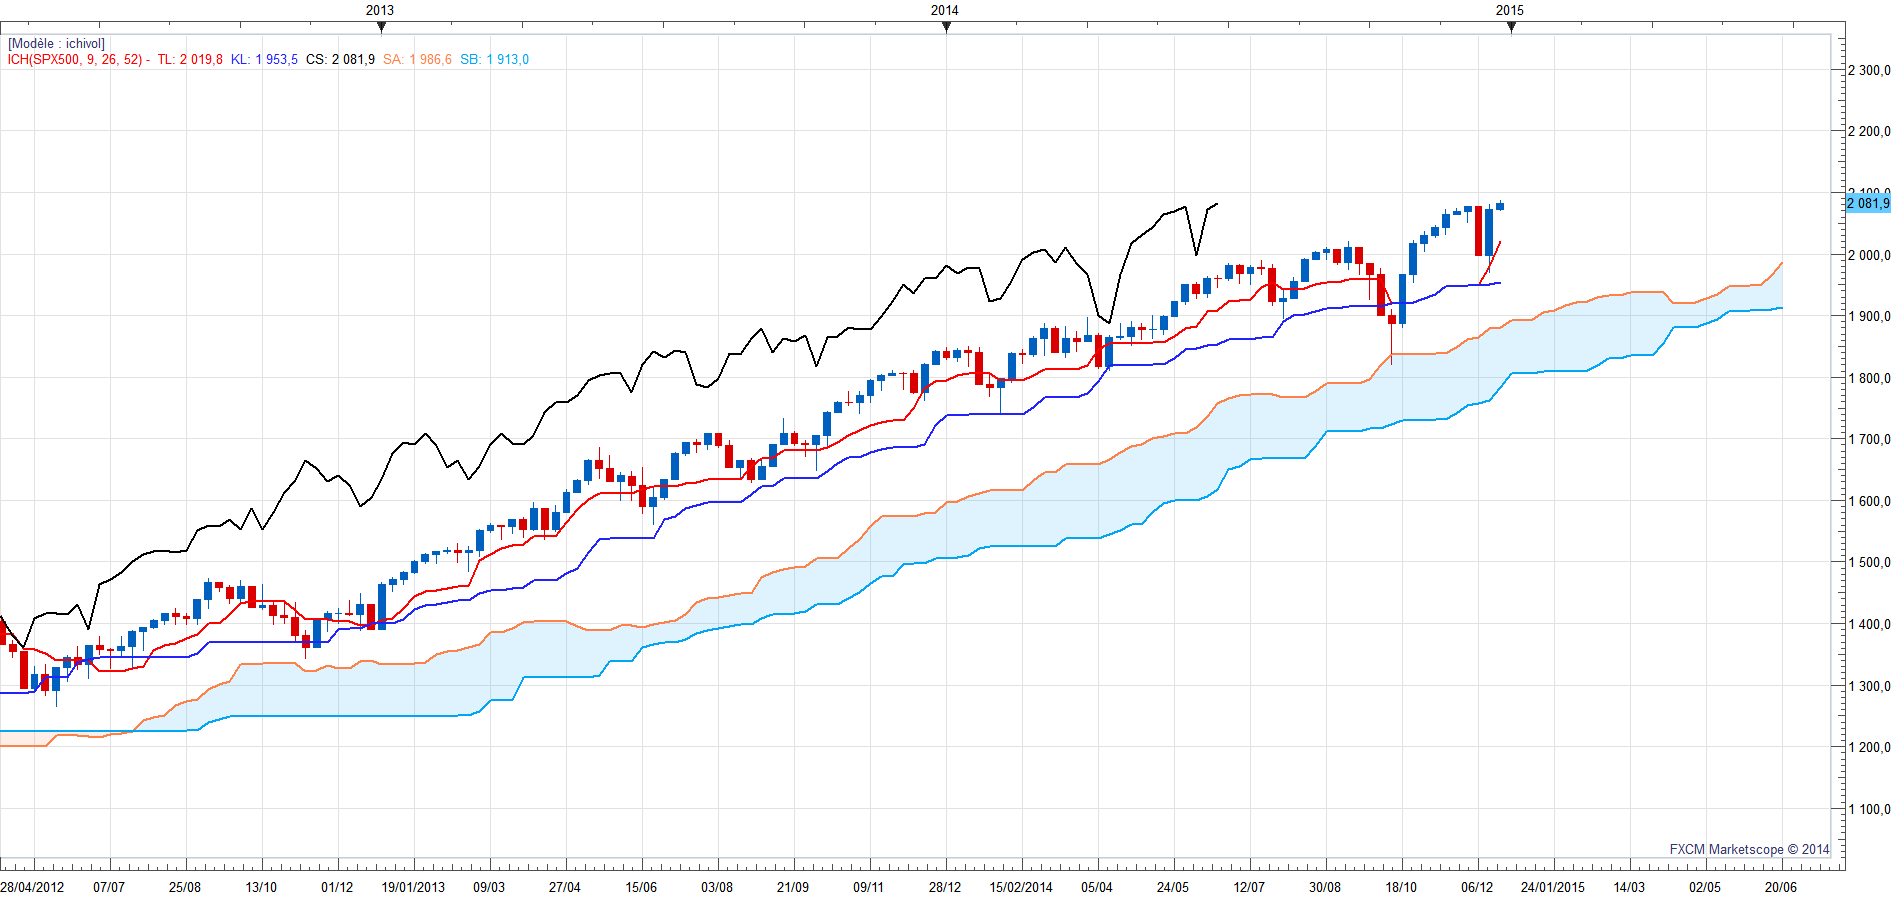
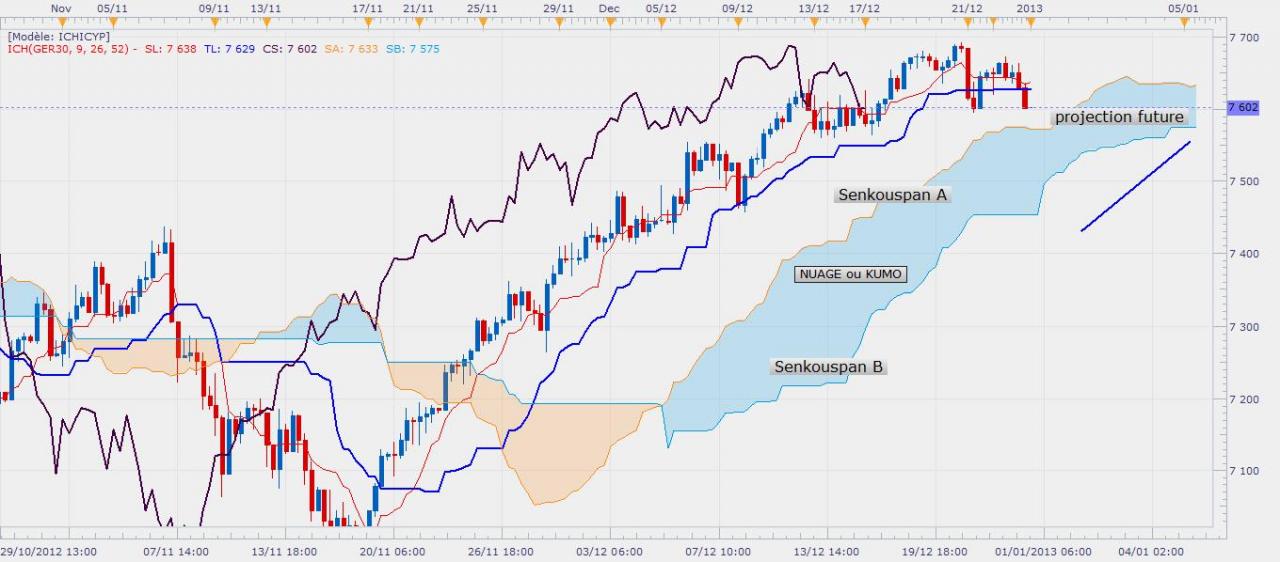
In the chart below, the cloud is perfectly oriented upward. This indicates that the trend is undeniably bullish. Based on this information, the Ichimoku trader will look for buying opportunities.
Charts created with FXCM Marketscope 2
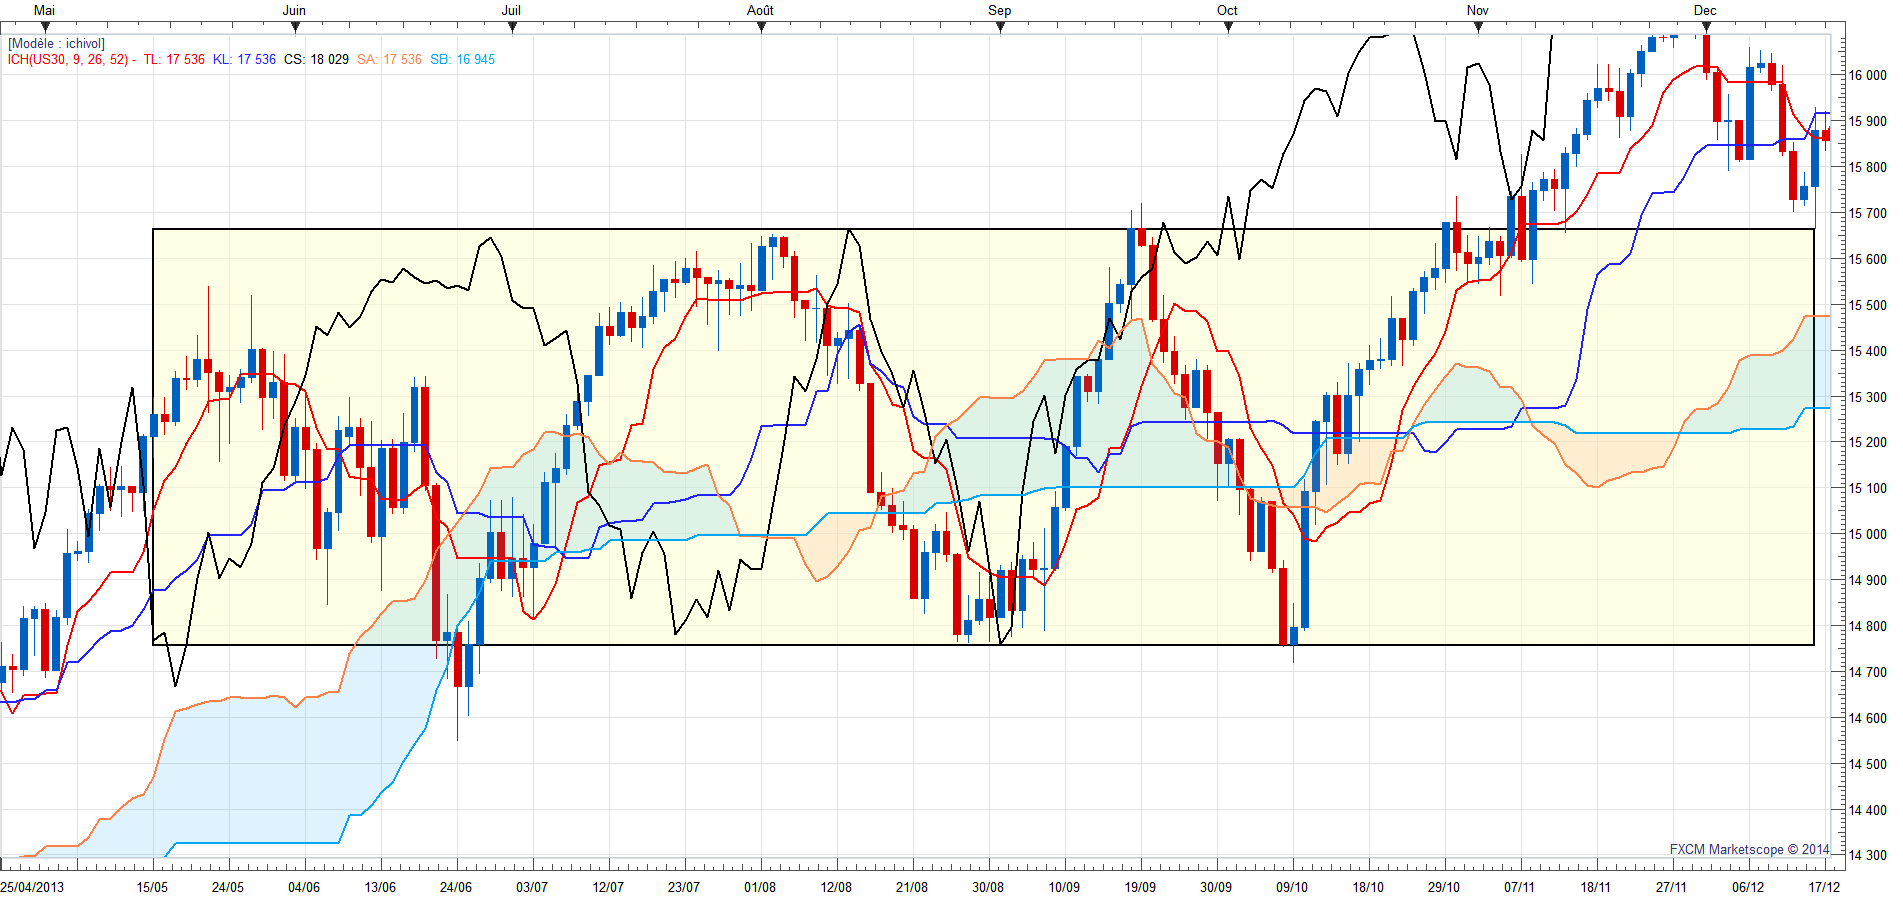
On the chart below, the Ichimoku cloud ( I call 'cloud' the whole ensemble of clouds) is flat and horizontal, which indicates us that there is no trend. In other words, it means that the prices are drifting laterally (range). The use of Ichimoku during a range phase is different from a trend phase. In this case, the trader will look for opportunities to trade the range. The Ichimoku lines (especially the SSB) will then represent the equilibrium of the range. They will no longer act as a support or a resistance for the prices and the Chikou-Span.
The twist
Ichimoku is an analysis tool that provides immediate visual indications (effectively enabling you to catch the trend at a glance). As we have seen in the previous chapter, it is possible, simply by observing the global orientation of the Cloud, to know whether prices are in a trend phase, or in a range phase. The twist also delivers crucial visual information that we can use efficiently in our trading. The twist is the crossing of the two lines forming the cloud, the SSB and the SSA. The onset of a twist during a trend phase indicates that the trend is losing its momentum. During a range phase, the twist indicates that the prices are unable to achieve new lows or highs over a given period.
Understanding how and why the twist appears is cool, but more importantly, we want to know how to use this signal. Once we have noticed a twist, how can we use this information to improve our trading?
Very often when the cloud twists after a trend phase, prices enter into range phases (In 75% of the cases). The twist just indicates a weakening of the trend, and by no means indicates an upcoming trend change.
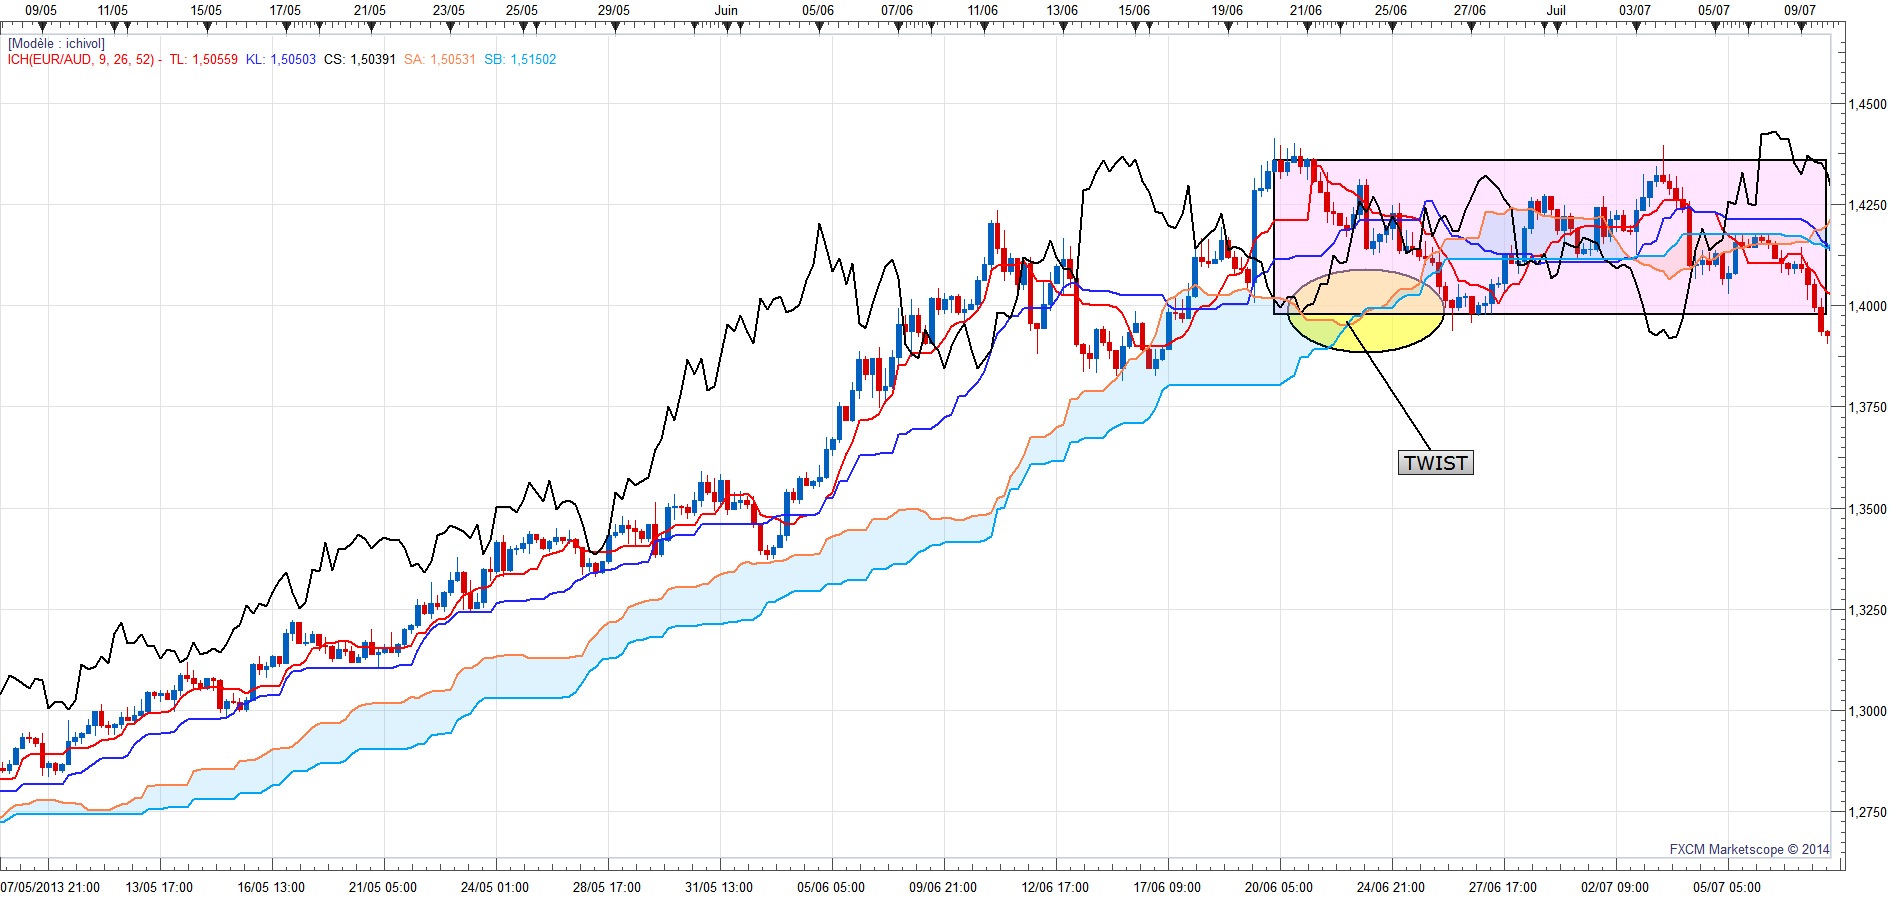
As shown in the picture below, after a long and nice bullish trend, the lines of the cloud (SSA and SSB) intersect to form a 'twist'. Immediately after this twist, the trend is clearly faltering, and prices enter into a lateral drift phase (range phase).
As you will see later in the chapter about Senkou-Span A and Senkou-Span B, this information is given to us in advance. It gives the trader time to adjust and to eventually take his profits. The trader can also get ready to trade the potential upcoming range phase. By noticing the twist, we will know before the others that the trend is likely to run out of steam, and we will be ready to trade the range before everyone else.
IMPORTANT:
The twist of the Cloud is often falsely considered as a weak spot of the cloud, a breach where prices and Chikou are supposed to jump in. This is absolutely incorrect, since there is no evidence to back this assumption! It is very common to see the prices or the Chikou-Span cross the cloud while ignoring the twists, and there are just as many examples where the prices and the Chikou-Span are unable to cross the twist.
My Ichimoku course clearly demonstrates that the twist is not a weak spot where the prices and the Chikou-Span can cross the cloud more easily. This is a huge mistake!
In my course, I show you what the twist is all about, what it tells you, how to interpret it, and how to use it. Statistically, when a twist appears after a trend phase there is a 75% probability of entering a range phase (lateral drift). Furthermore, when a trader sees a horizontal Cloud with a series of twists, he knows that the market is in a range phase. He can then trade the range.
In this kind of situation (range), you will find that the prices and Chikou do not necessarily go through the twist. They bounce from the upper limit of the range to the lower limit of the range. They cross the cloud just anywhere, even through the thickest parts.
If you look at the second chart on this page then you will see an example of this. During a range phase, the prices bounce from the Upper Limit to the Lower Limit. Twice they went through the thickest part of the cloud, and twice they went through the twist. It's a simple coincidence. They bounce from one limit to the other, crossing the Ichimoku lines, while totally ignoring whether there is a weak twist or not!
Therefore, it is wrong to say that there is a reversal in the trend when prices and Chikou-Span cross the Cloud. There will be a reversal of trend if, and only if, prices break the range in the opposite direction of the previous trend. If you do not understand this then you will inevitably lose a lot of trades...
In my Ichimoku Course, ICHIMOKU KINKO HYO THE COMPLETE COURSE, you will find a detailed chapter about this topic including many examples and a video. In this essential chapter of the course, I explain in detail how to understand, interpret and use the twist. To illustrate the idea, I also give concrete examples of how to trade during a range phase.
You can also watch the videos (in French) of my YouTube Channel dedicated to Ichimoku, where I often explain how to use all these techniques.
The cloud is made of two lines, Senkou-Span A and Senkou-Span B.
Senkou-Span A (SSA) is the average of the Tenkan and the Kijun plotted 26 periods into the future, while Senkou-Span B (SSB) is the average of the last 52 highs and lows, plotted 26 periods into the future. This means that the present price movement determines the upcoming Cloud, and the space between these two lines forms the cloud itself (Kumo).
Forget all about colors, forget about bullish is blue and bearish is orange. In fact, as we have seen earlier in this chapter, everything is relative, and depending on whether we are in an actual trend or in a lateral drift. The color of the cloud is meaningless during a range phase.
The SSA and the SSB as support and resistance
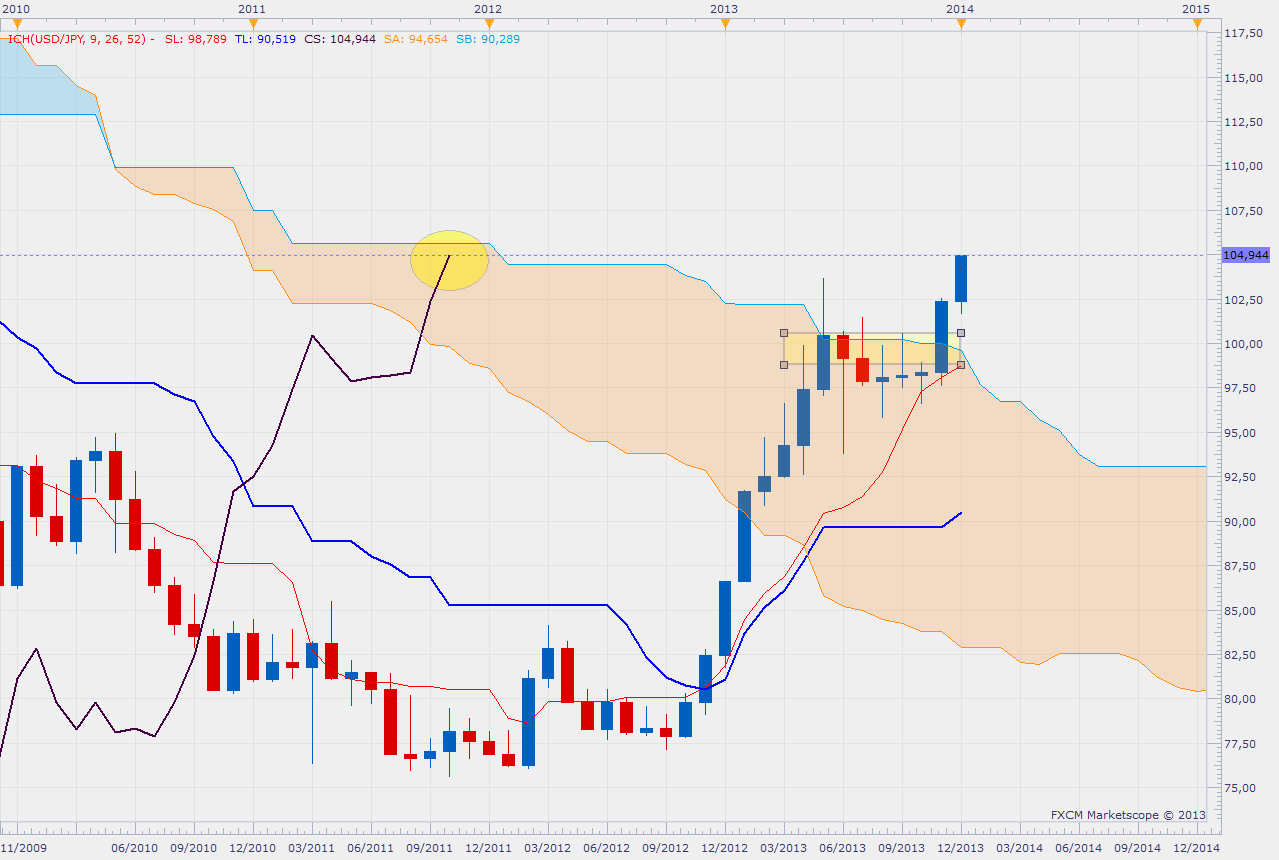
On the chart below, you can see an example of the SSB acting as a resistance for the prices and for Chikou. This is the monthly chart of the USDJPY. Here the prices attempted to break the SSB (yellow rectangle) six times (six months). In the ellipse, we can see that Chikou is about to confront the SSB of the cloud, which will be a strong level of resistance for Chikou. The example of Chikou confronting the SSB is very important. The prices appear to be free from any resistance. Nonetheless, as long as Chikou fails to break this SSB, we have no valid buy signal. For a trader with an open position, it is probably time to consider taking profits, as a strong downturn is very likely.
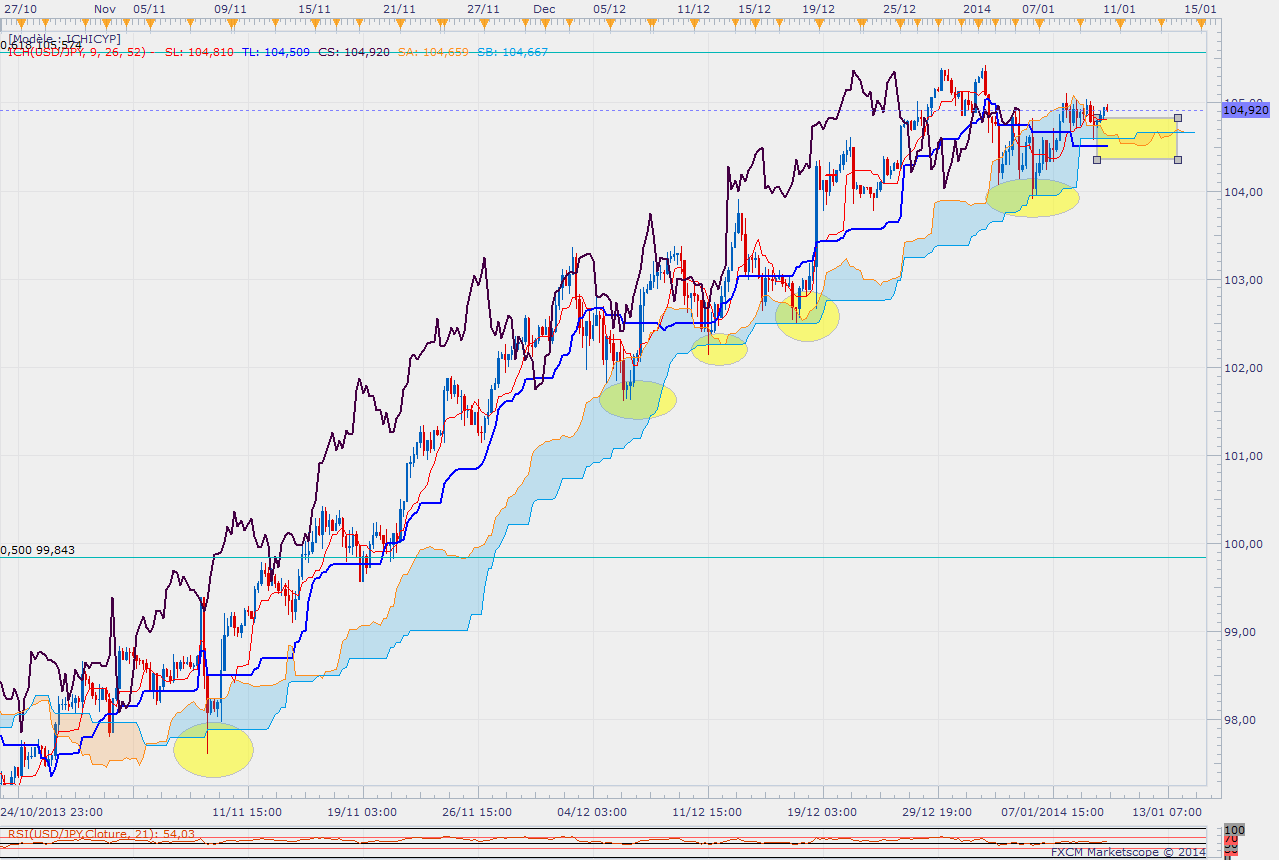
The two graphs below show us:
1) A cloud that is perfectly oriented (it is clearly inclined towards the direction of the trend), with an SSB fully playing its role as a support level (yellow ellipses).
2) A twist in the cloud, informing us of a steam loss in the trend, which is probably indicating an upcoming range phase.
The example below shows that any former flat line in the cloud (especially the SSB) is an important S/R level. An extension line is drawn from an old SSB Flat (this is also valid for the SSA, but the SSB is more accurate). This technique allows us to spot S/R levels, but also to define targets for our trades. The SSB line delivers surgical precision. It gives very accurate targets!
The longer and flatter the SSBs are, the more difficult it will be to break them. The higher their timeframe, the stronger their resistance.
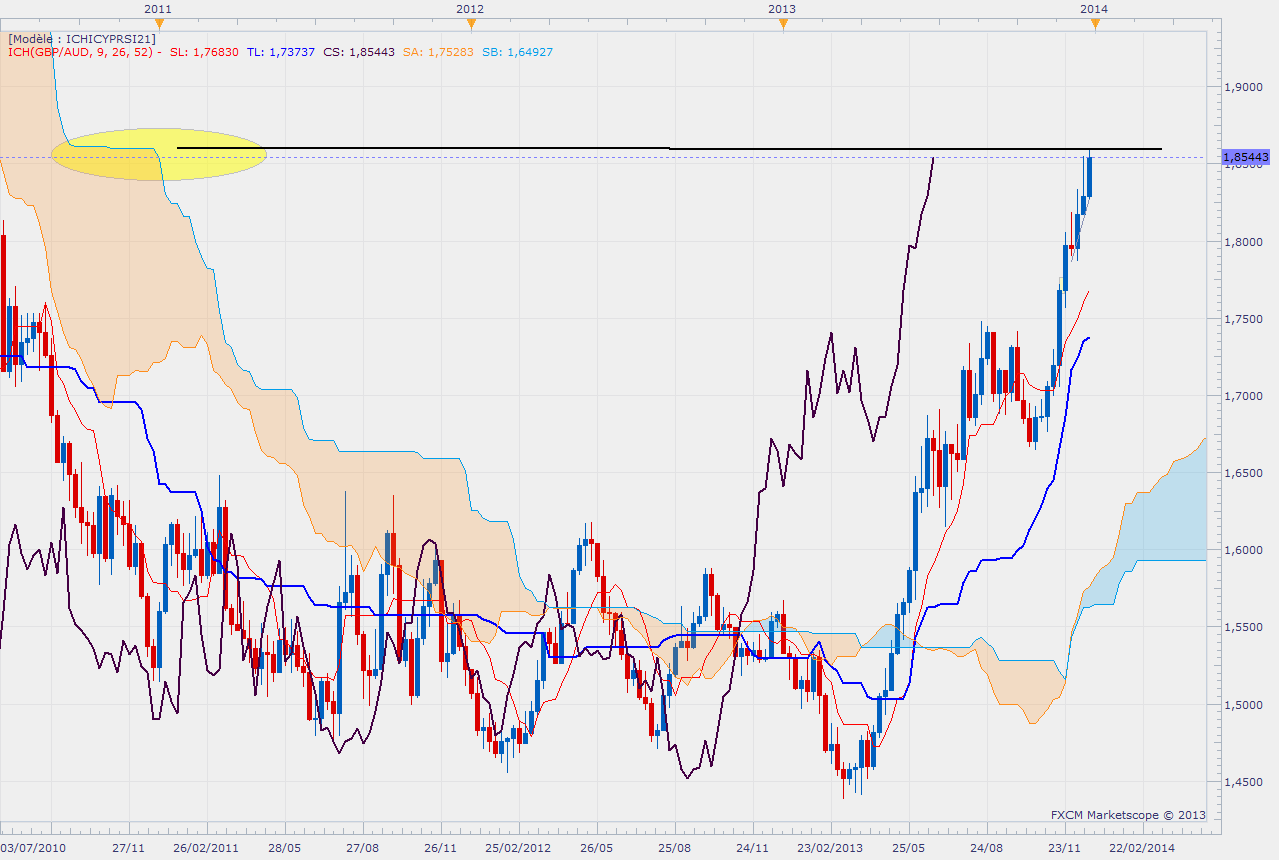
In the example below, the trader should consider taking profits. This SSB extension was a perfect target! The probability of a retracement on this level is very high.


